Which way is the stock market headed?
Disclaimer: In no way, shape, or form is this financial advice. Invest and/or trade at your own risk.
Theoretically, the stock market can only move in three major directions: up, down, or sideways. People who make market predictions usually make a prediction on where the market is headed while including some type of timeline. Therefore, in addition to calling the direction, they usually make a timeline prediction as well. In order to be “correct,” they have to not only call the direction but also have to get the time of this direction right. For example, someone may call the market to hit a certain level but it may happen 10 years later. No wonder making market forecasts is so hard, especially on a smaller timeframe where noise and choppiness can head fake many.
Ever since the fed started Quantitative Easing 1 (QE1) in November of 2008 and the market bottomed shortly thereafter in the spring of 2009, the stock market has seen absolutely insane returns practically every single year. The cheap money has lead to a parabolic type chart on the major U.S. indices which recently topped around fall 2021. Since then, there has been a pullback with a bounce attempt. Looking at a long-term timeframe chart, which way is the market most likely headed?
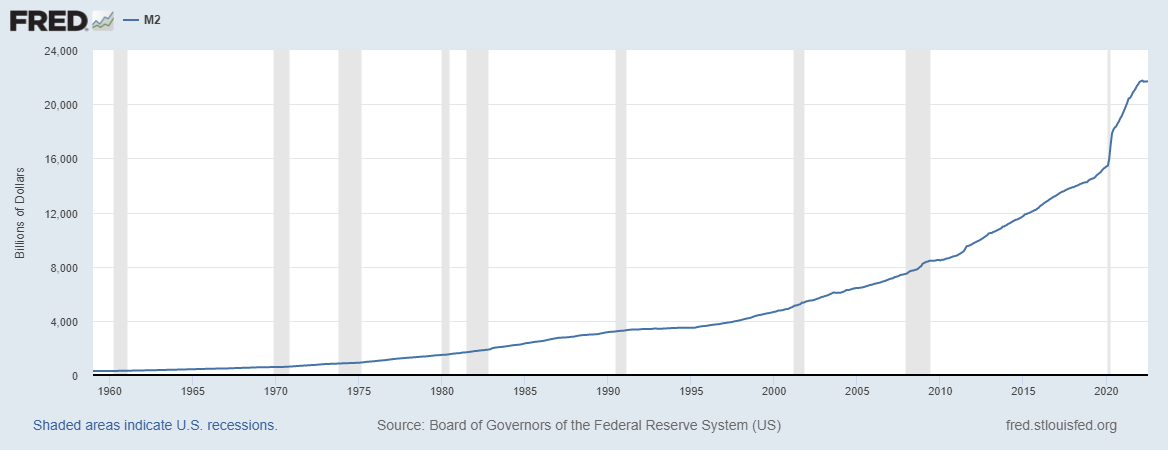
Given what has happened in the history books, anytime a government has printed this type of money it typically results in not only an inflationary environment as we are seeing, but also massive gains in the stock market. Never in the U.S. have we seen this type of money printing. In 2020 alone, over 40% of the money the US has ever printed in its history was printed.
If the stock market uptrend stays intact despite fear and pessimism, the U.S. stock market could easily repeat patterns seen in the Weimar Republic, Venezuela, and Argentina.
What happened to the stock market during Weimar Republic before the rise of Hitler?
Based upon the charts, the stocks rose in both marks and USD. More and more people started speculating to avoid taxation and in order to receive a dividend until the final holders couldn’t expect a return of even 1%.
Here is a chart:
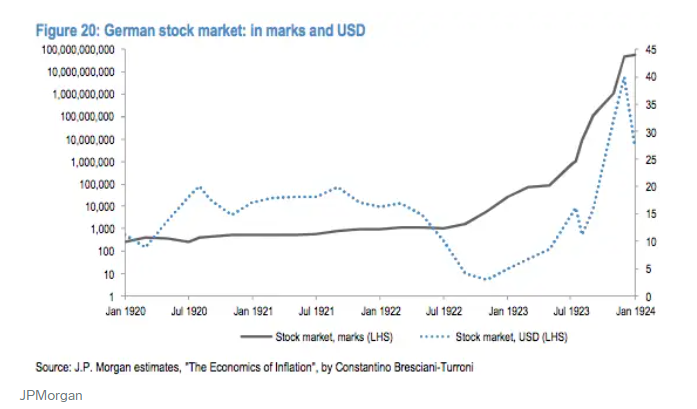
At the end of the Business Insider article this graph is from, the following summary is stated: “[b]ottom line: [i]n marks, stocks had an amazing run. Even in USD they had a nice runup” (Weisenthal).
In Venezuela, inflation hit nearly 1,000,000%.
What did the Venezuelan stock exchange do? It went up over 73,000%.
Let’s looked at the Índice Bursátil de Capitalización (IBC), which is also known as the General Index (the main and most important index of the Caracas Stock Exchange):

Finally, let’s take a look at Argentina. According to an article on Reuters, Argentina inflation is near 80% and specifically, “[i]nflation in the 12 months through August hit 78.5%, while prices were up 56.4% in the first eight months of the year” (Nessi and Bianco).
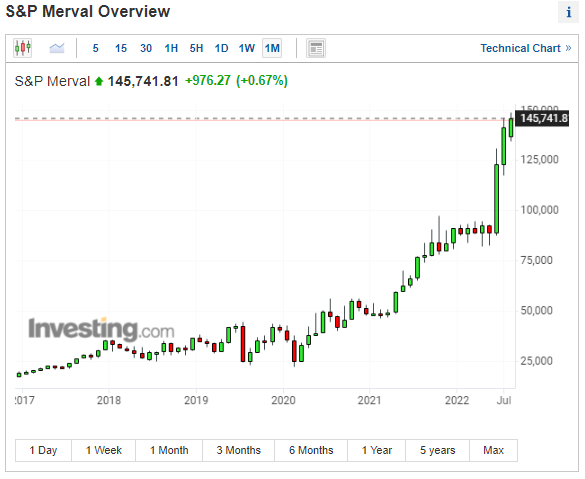
In response to this type of inflation, what has the Argentina stock market done? The S&P MERVAL Index, which is the most important index of the Buenos Aires Stock Exchange, has gone up about 3-fold since 2021 and most recently has started going parabolic.
Here is the chart:
Given that all three of these countries have seen larger increases in inflation than the U.S. is currently experiencing and witnessed extraordinary gains in their stock market’s, will the U.S. do the same?
The U.S. CPI data is just under 10 percent (though it is probably much higher in reality) so are we about to see a further increase in the stock market as the money printing likely accelerates to keep things running? It is certainly possible and probably likely.
Here is a chart of the current expansion of money supply:
Here is a look at what the S&P 500 has done during Quantitative Easing which, again, started in November 2008:
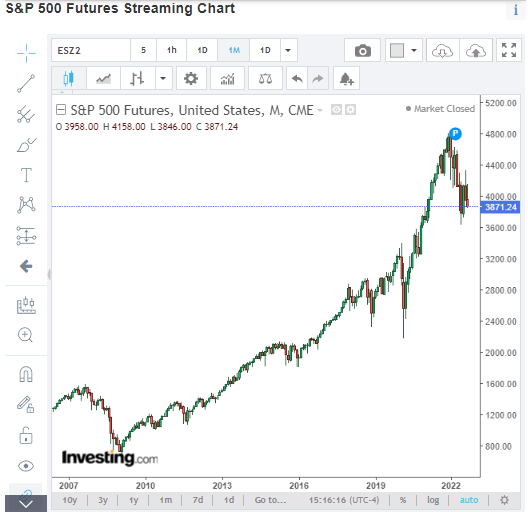
Obviously nobody knows the future 100 percent, but the old saying that history repeats itself or rhymes may hold true. Many things are happening right now that suggest the U.S. stock market may see another blow-off the top, especially given we are in an unprecedented monetary environment. Unlike the stock market crash during the late 1920’s and early 1930’s, we have obscene amounts of money printing and unbelievable amounts of debts. The trend is up (and usually the trend is your friend) and fighting the fed hasn’t worked in the past, so it probably won’t work in the future.
If I had to make a market forecast, I would say we either see a massive move to the upside or a massive move to the downside – more likely to the upside than the downside. If we see the market continuing to trend upward this fall, I would bet on the former and vice versa. We seem to be at a pivot point and only time will tell…
Works Cited
“Bursatil Index (IBC).” Investing.com, https://www.investing.com/indices/bursatil.
“M2.” FRED, 23 Aug. 2022, https://fred.stlouisfed.org/series/M2SL#.
Nessi, Hernan, and Miguel Lo Bianco. “Argentina Inflation Nears 80%; Spiraling Prices Squeeze Shoppers.” Reuters, Thomson Reuters, 14 Sept. 2022, https://www.reuters.com/markets/us/argentina-inflation-nears-80-spiraling-prices-squeeze-shoppers-2022-09-14/.
“S&P 500 Futures Streaming Chart.” Investing.com, https://www.investing.com/indices/us-spx-500-futures-chart.
“S&P Merval Index (Merv).” Investing.com, https://www.investing.com/indices/merv.
Weisenthal, Joe. “Here’s What Happened to Stocks during the German Hyperinflation.” Business Insider, Business Insider, 26 Nov. 2011, https://www.businessinsider.com/heres-what-happened-to-stocks-during-the-german-hyperinflation-2011-11.
